Tracking growth around airports
Atlas AI data on how the catchments around airports are growing, as an input to Airbus’s passenger-demand forecasts.
Pulse is a subscription monitoring service. It detects construction, settlement, land use, and roads from Earth observation data, with population and economic estimates on top, and delivers the results as data for the systems you already run.

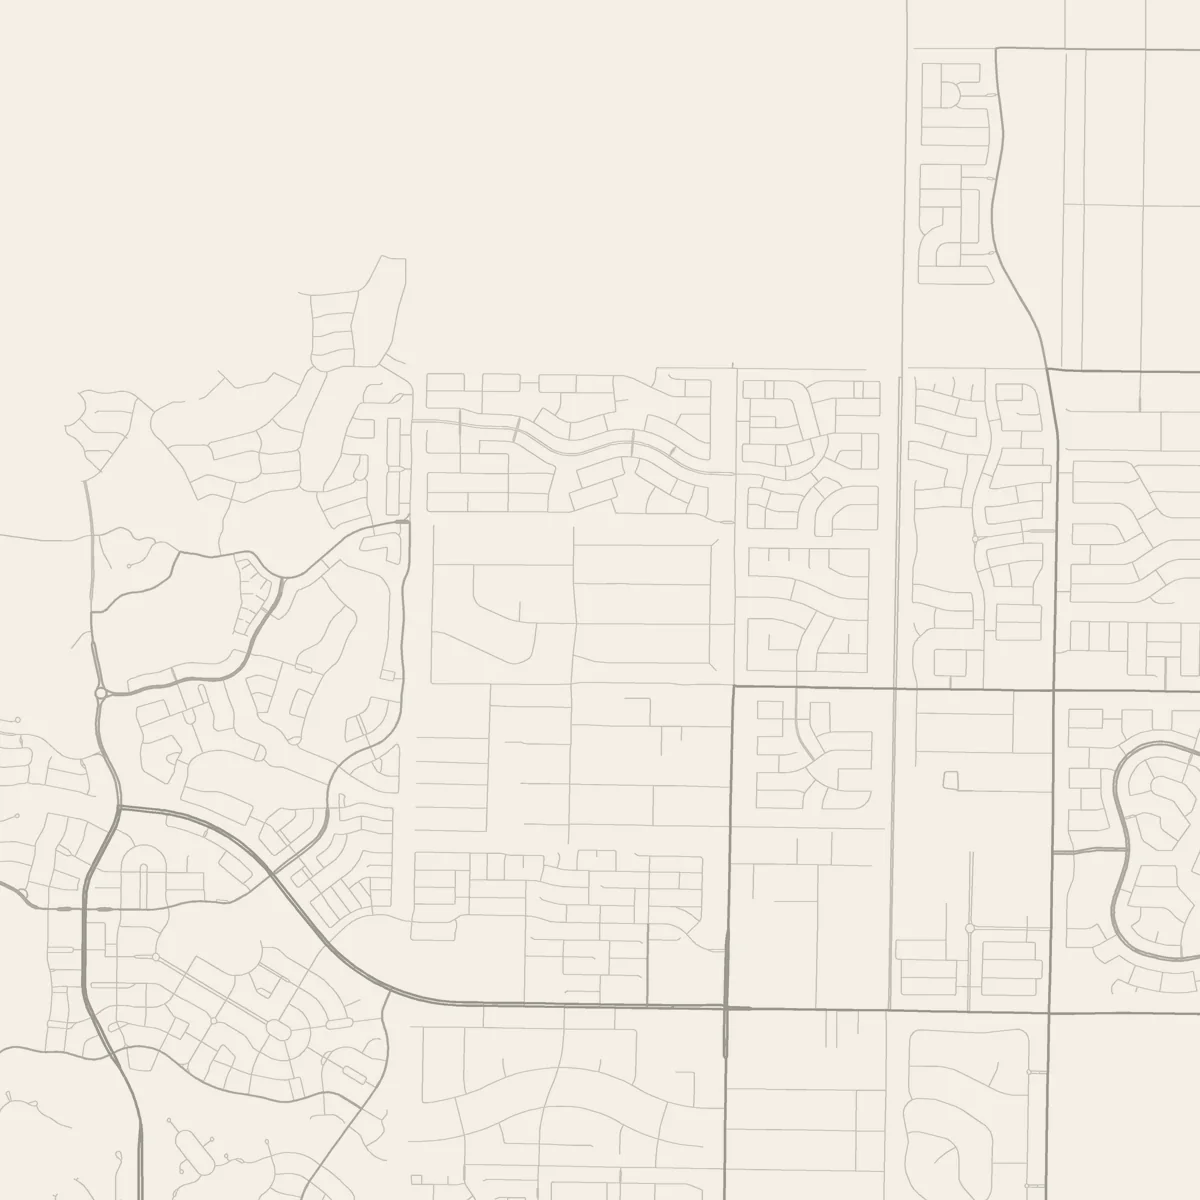
FIG. 1A block in Buckeye, Arizona, that the 2020 Census counted as empty, and the new development Pulse detected on it.
Pulse, 10 m, 2017–2024. Contains modified Copernicus Sentinel data. Roads © OpenStreetMap contributors. Census: US Census Bureau.
Most data about places arrives only after a census is taken, a record is filed, or a place opens. Pulse detects the change itself, from the foundation stage.
Development agencies
TodayA census that can be decades old (the Democratic Republic of the Congo’s last full count was in 1984), and household surveys every few years.
With PulseSettlement and infrastructure change, updated as often as monthly, with population estimates on top.
Supply-chain firms
TodayBroker pipelines and property records for the markets they cover, and annual American Community Survey estimates, published months after the year they describe.
With PulseNew neighborhoods and warehouse capacity as they’re built, on one method in every market, including the ones no pipeline covers.
Investors
TodayAlternative data on footfall, transactions, and occupancy, which begins only once a place is open.
With PulseConstruction and demolition across whole markets, before a place opens.
Mapping companies
TodayGlobal layers updated in multi-year steps (the EU’s settlement map is modeled from 2018 imagery), or costly re-surveys.
With PulseChange detected wherever you need it, so updates go where the map is out of date.
Census: Al Jazeera, 2026; US Census Bureau. Settlement map: European Commission, Joint Research Centre, GHSL Data Package 2023.
Atlas AI data on how the catchments around airports are growing, as an input to Airbus’s passenger-demand forecasts.
Network expansion in Zimbabwe planned against settlement-level demand. In Harare, new development Pulse detected in 2023 was confirmed in 2024, on land that was empty in 2021.
Settlement and population estimates that show which communities sit outside health-facility catchments, for immunization outreach across an Indian state, with Gavi and UNDP.
New and demolished buildings and roads, city-wide, in three African cities.
Used across five sectors
Peer-reviewed
In our peer-reviewed comparison with the EU’s Global Human Settlement Layer, Atlas AI’s settlement data averaged an F1 score of 0.78 against 0.63, and led in all eight areas tested across six countries. Big Data from Space 2025
Tested in Kigali
Across Kigali, a dense city with large informal settlements, Pulse’s settlement data beat the closest comparable open dataset on every measure we tested.
Checked in the field
GiveDirectly verified Atlas AI’s household-spending estimates in Mozambique through field visits, before directing cash transfers with them.
Choose the areas, a package, and an update schedule, and add history or add-ons if you need them. Each subscription is priced by its area and update schedule.
Package · Base
What is being built, changed, or removed.
Package · Bundle
Everything in Base, plus land use and land cover, and the road network.
History
The same areas back to 2016, the first full year of Sentinel-2 imagery.
Add-ons
Input: Earth observation data, currently Copernicus Sentinel-2 imagery. Formats: raster (GeoTIFF), vector (GeoJSON), and tables (CSV, Parquet). Licensed as an annual subscription. Data and security →
Real Pulse output for Phoenix, Arizona, one year at a time from 2017 to 2024. Subscriptions can update every month.


Pulse, 10 m, 2017–2024. Contains modified Copernicus Sentinel data. Roads © OpenStreetMap contributors. 2020 Census: US Census Bureau.
This view covers about 12,100 km² of the Phoenix metro. Pulse detected more than 13,000 hectares of new development here since 2017, more than a tenth of everything built. Its busiest areas are in these six places.
Hectares of new development in the busiest 4 × 4 km area of each place.
By 2022 it had detected 26 hectares of new development on the 67‑hectare block. The next full census is in 2030.
Building picked up in 2021 and has stayed high. Pulse also detected 4.3 hectares of buildings that came down.
| Year first detected | New development (ha) |
|---|---|
| 2018 | 7.7 |
| 2019 | 27.1 |
| 2020 | 34.2 |
| 2021 | 69.4 |
| 2022 | 80.3 |
| 2023 | 59.7 |
| 2024 | 54.9 |
About 20M sq ftof new warehouse-scale footprint in this 6 × 6 km area.
Pulse picked up nine of the 29 while they were still going up. In any region you monitor, you see new capacity and new competition while it’s still being built.