
The High Level Overview
In 2019, we embarked on an ambitious undertaking with our wonderful collaborators at the World Bank to help close the agricultural data gap. Together, we proposed a work plan in support of the 50x2030 Initiative: a global collaboration that brings together the strongest partners in agricultural development to improve country-level data in 50 countries in Africa, Asia, the Middle East and Latin America by 2030. Our end goal was aimed at addressing two key barriers to scaling-up integrated satellite-survey applications in the Agriculture space:
- Knowledge regarding the required volume, methods, and content of georeferenced, objective microdata
- Access to and analysis of existing, georeferenced microdata
Our joint work program — The Integration of Satellites and Surveys for High-Resolution Crop Type Mapping and Crop Yield Estimation — aims to generate satellite-derived public datasets and maps for multiple cereal crops in five countries. In addition, we are publishing protocols for the required volume, methods, and content of georeferenced microdata collection as part of all 50x2030-supported surveys.
It was an honor and a privilege to see the first portion of our collaboration officially released as part of the launch of the World Development Report 2021. Our work was brought to life as a Data Story, released as a Working Paper entitled Understanding the Requirements for Surveys to Support Satellite-Based Crop Type Mapping : Evidence from Sub-Saharan Africa, and our teams are currently putting the finishing touches on the backend infrastructure needed to make all of this data free and easily accessible to all.
The Technical Details
Our analysis focused on maize cultivation in Malawi and Ethiopia and leveraged rich, georeferenced plot-level data from national household surveys (conducted in 2018–20) that are integrated with Sentinel-2 satellite imagery and complementary geospatial data.
Together, we quantified the interactive effects of (i) approach to georeferencing plot locations (see Figure), (ii) size of the training dataset, (iii) plot size, and (iv) satellite data sources, on the performance of a machine learning-based maize classification model in the context of Malawi and Ethiopia.
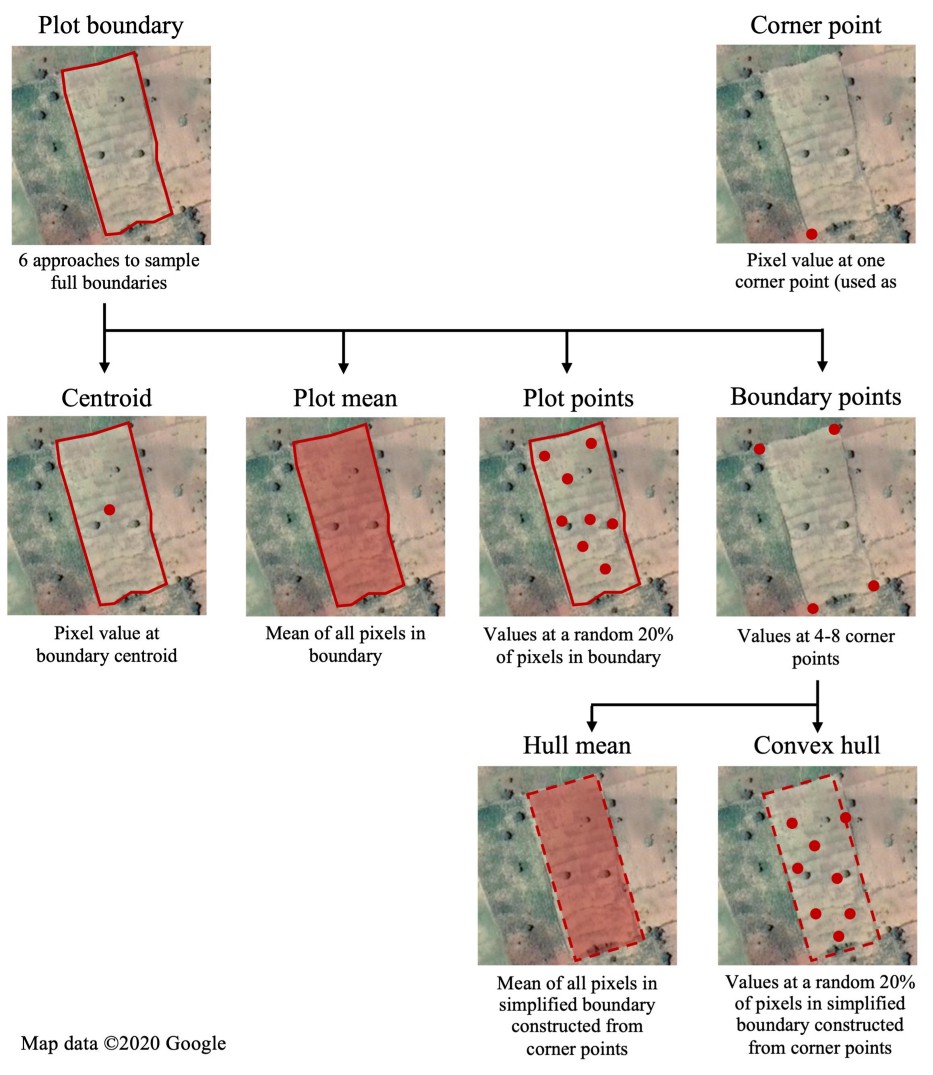
We found that collecting a complete plot boundary and then using features aggregated over the entire plot (i.e. plot mean) is the most preferred strategy in terms of classification performance. The second-best strategy, which gave comparable model performance, was the approximation of full plot boundaries using GPS coordinates of the complete set of plot corners. If only a single GPS point can be gathered by data collectors, we found that the location should be near the center of the plot rather than at the plot corner. Overall, georeferencing plot centroids was the third-best strategy for remote sensing model training purposes. We also found that full plot boundaries or multiple corner points provide significant gains vis-a-vis plot corner points or plot centroid, when only a few observation plots (less than 1,000 plots) were available. With mid-sized samples (3,000 to 4,000 plots), plot centroids produced similar performance to full plot boundaries. With large sample sizes (around 7,000 plots), plot centroids fell behind full plot boundaries.
Furthermore, we found that the classification performance almost always peaked before or at around 4,000 plots under the preferred geolocation strategies. As such, collecting high quality plot boundaries from 4,000 plots was found to be preferable as compared to collecting corner points from 7,000 plots. Moreover, we demonstrated that no plot observations should be excluded from model training on the basis of a minimum plot area threshold. Finally, the experiments to quantify the effect of satellite data sources on crop type classification performance suggested that optical features alone can provide sufficient signal to maximize prediction quality. We observed only small differences between models built only with optical features and those using optical and synthetic-aperture radar (SAR) features. In the case of maize area mapping in Malawi, the potential benefits offered by SAR — providing signals unaffected by cloud cover — were offset by additional noise introduced with SAR imagery.
To learn more, join us at the Inaugural 50x2030 Seminar Series to explore survey support for satellite-based crop type mapping on 15 April 2021. Register here.
Learn more about the 50x2030 Initiative.
Read our Working Paper — Understanding the Requirements for Surveys to Support Satellite-Based Crop Type Mapping: Evidence from Sub-Saharan Africa.
Links to Malawi and Ethiopia raster data:
- High-Resolution Crop And Maize Area Mapping For Ethiopia
- High-Resolution Crop And Maize Area Mapping For Malawi
